library(tidyverse)
library(spotifyr)
library(ggtext)
# Stored API code in config folder and added to gitignore file
# source("./posts/spotify api/config.R")
source("./config.R")
# Access API username + id
Sys.setenv(SPOTIFY_CLIENT_ID = spotify_id)
Sys.setenv(SPOTIFY_CLIENT_SECRET = spotify_code)
spotify_access_token <- get_spotify_access_token()
spotify_id <- function(artist_name) {
# Removed print so there is no echo in Quarto doc
artist_id <- search_spotify(artist_name, type = "artist") %>%
select(id) %>%
slice(1) %>%
as.character()
return(artist_id)
}
artists_i_like <- c("Taylor Swift",
"Bon Iver",
"Leif Vollebekk",
"Glass Animals",
"Noah Kahan",
"Hozier")
# Practice with lapply + map :)
dat <- lapply(artists_i_like, search_spotify, type = "artist")
artists <- dat %>%
map( ~ .x %>%
as.data.frame() %>%
slice(1) %>%
pull(id)) %>%
unlist() %>%
# Use map instead of a loop to keep a clean env
map( ~ .x %>%
get_artist_audio_features(.,
include_groups = "album",
authorization = spotify_access_token)) %>%
do.call(rbind.data.frame, .)
annotater <- function(x_val, y_val, text_used) {
annotate("richtext", x = x_val, y = y_val, label = text_used, size = 6, alpha=0.9, label.color = NA, family="Avenir Next")
}
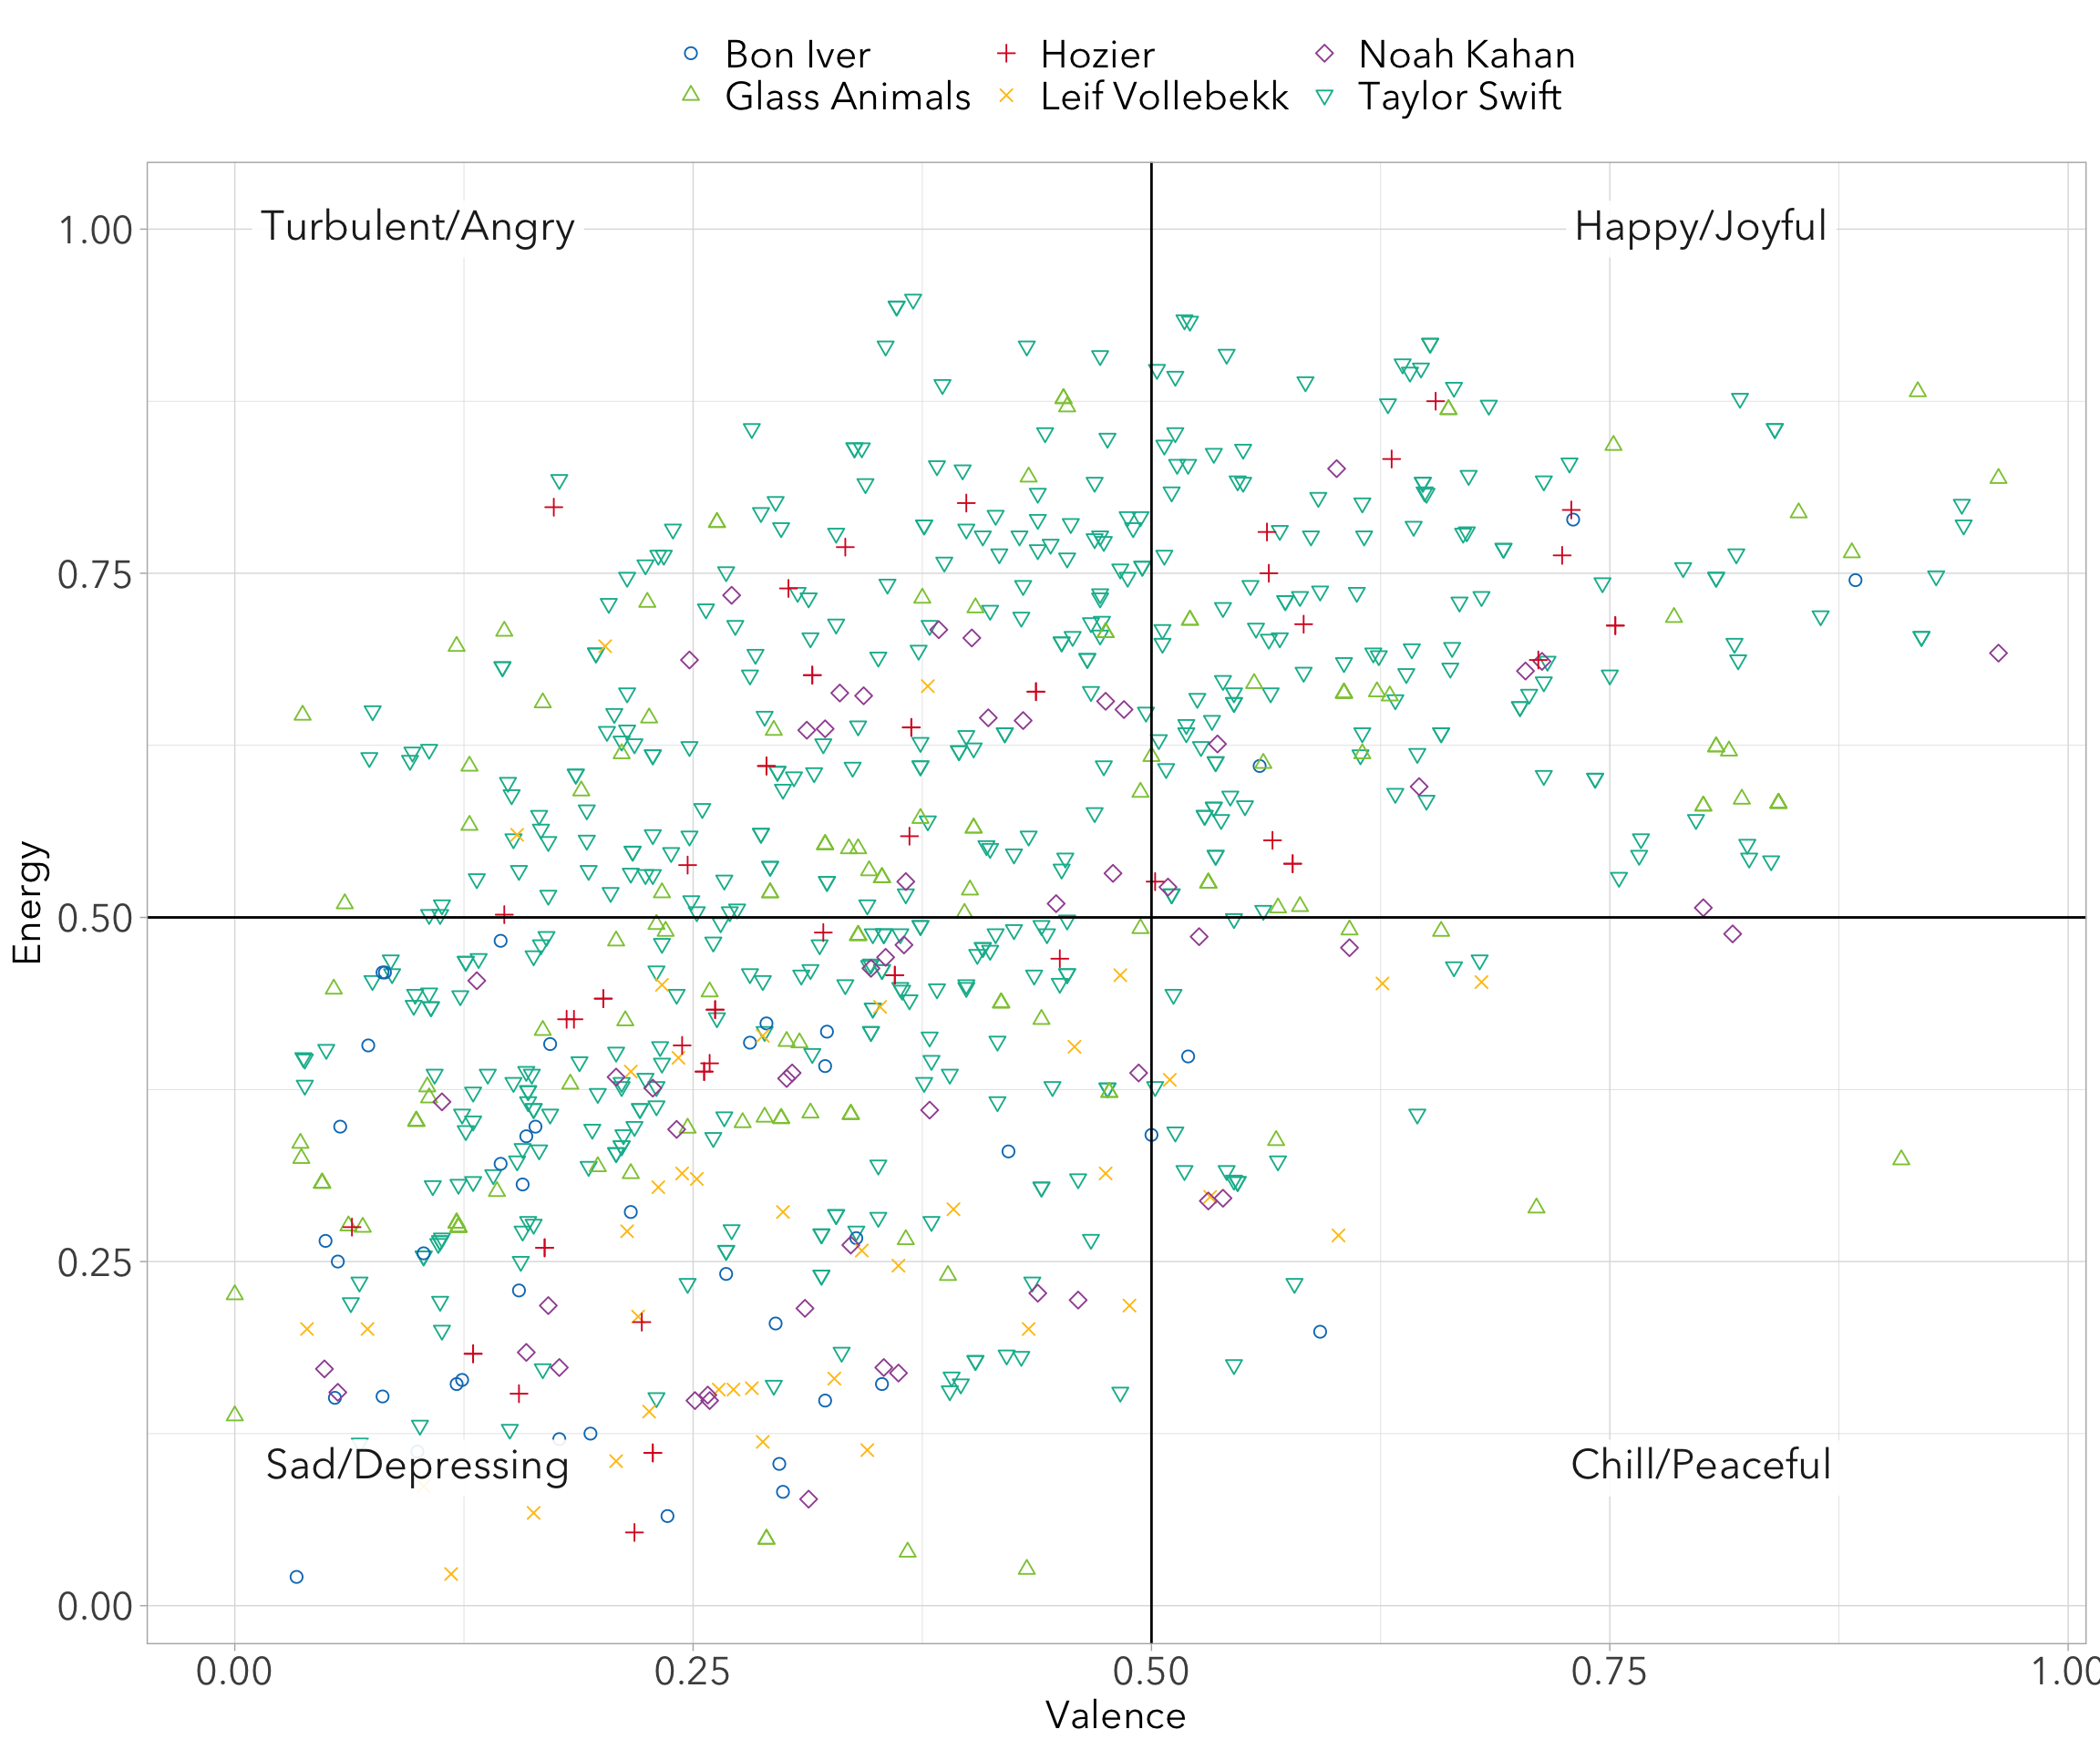
# Apparently I don't like peace ;(
artists |>
# Feed into ggplot
ggplot(aes(y=energy,x=valence,color=artist_name))+
geom_point(aes(shape=artist_name), size = 2)+
geom_hline(yintercept = 0.5)+
geom_vline(xintercept = 0.5)+
annotater(x_val = 0.1, y_val = 1, text_used = "Turbulent/Angry") +
annotater(x_val = 0.8, y_val = 1, text_used = "Happy/Joyful") +
annotater(x_val = 0.1, y_val = 0.1, text_used = "Sad/Depressing") +
annotater(x_val = 0.8, y_val = 0.1, text_used = "Chill/Peaceful") +
# Threw in oecdplot package for fun
oecdplot::scale_colour_oecd_d(option="ppt") +
theme_light() +
scale_shape_manual(values = c(1:8))+
labs(y = "Energy", x = "Valence") +
theme(legend.position = "top",
legend.margin = margin(t = 0.009, r = 0.1, b = 0.009, l = 0.1, unit = "npc"),
axis.text.y = element_text(size=16),
axis.title.y = element_text(size=16),
axis.title.x = element_text(size=16),
axis.text.x = element_text(size=16),
legend.text = element_text(size=16),
text = element_text(family="Avenir Next"),
legend.title = element_blank())